
IBM SPSS is a comprehensive system for analyzing data. SPSS can take data from almost any type of file and use them to generate tabulated reports, charts, and plots o distributions and trends, descriptive statistics, and complex statistical analyses. SPSS makes statistical analysis more accessible for the beginner and more convenient for the experienced user. Simple menus and dialog box selections make it possible to perform complex analyses without typing a single line of command syntax. The Data Editor offers a simple and efficient spreadsheet-like facility for entering data and browsing the working data file.
 Loading
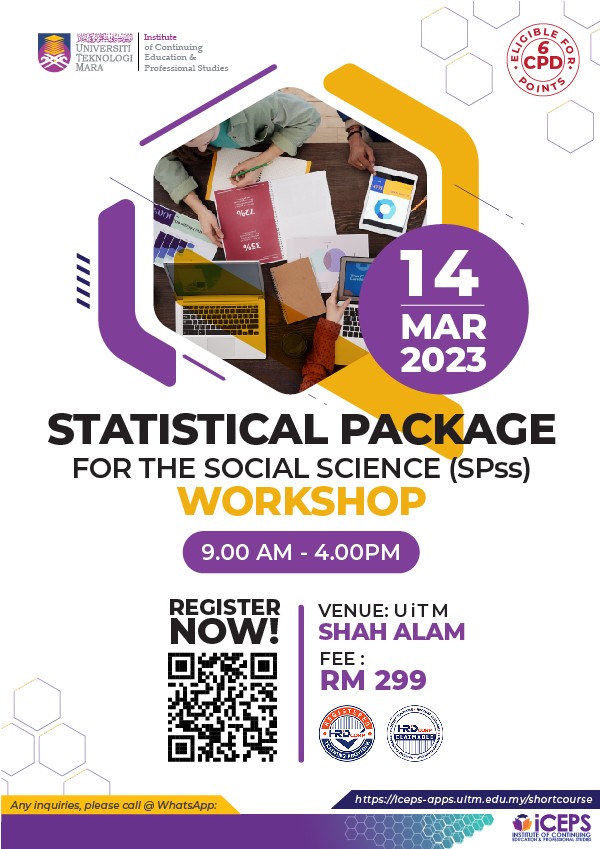
STATISTICAL PACKAGE FOR THE SOCIAL SCIENCE (SPSS) WORKSHOP
ICT
STATISTICAL PACKAGE FOR THE SOCIAL SCIENCE (SPSS) WORKSHOP
ICT
Registration Closed
| 14/03/2023 Tentative is available below. | |
|
To Be Informed
iCEPS UiTM Shah Alam 40450, Shah Alam Selangor |
For any inquries, please contact :-
FARAH QHAIRUNNISA MOHD YAZID
| 01151679198 | |
| farah384@uitm.edu.my |
MOHAMED SHAHID BIN MOHAMED ZAHAR
| 0355448352 | |
| mdshahid@uitm.edu.my |
Description
Objective
SPSS provides data analysis for descriptive and bivariate statistics, numeral outcome predictions and predictions for identifying groups. The software also provides data transformation, graphing and direct marketing features. The software interface displays open data similarly to a spreadsheet in its main view.
Who Should Attend?
Open to all who are interested.
Outline
This workshop will teach participants the fundamental procedures that will allow them to continue by their own. After completing these workshops, participants will be able to:
1. Describe the SPSS interface
2. Enter and save data
3. Import data from Excel
4. Explore data analysis
5. Create charts, histograms, and box plots
6. Transform variables
7.Perform elementary statistical analyses such as t-test, Chi-squared, correlation, regression, and one -way ANOVA with the respective nonparametric statistics.
8. Perform advanced statitiscal analyses such as multiple regression, twofactor ANOVA, and ANCOVA.
9. Carry out the power analysis for each of the Statistics tests mentioned above.
Tentative
Time: 9.00am - 4.00pm